Write short note on OPEC?
Organisation of Petroleum Exporting Countries (OPEC) was started in 1960 to benefit the oil exporting countries. Originally, it had Iran, Iraq, Kuwait, Saudi Arabia and Venezuala as its members. Its’ an example of cartel. By the year 1973, eight more countries joined i.e., Algeria, Nigeria, Gabon, Ecuador, Qatar, Libya, UAE and Indonesia, then, it had 13 member nations. Later Ecuador and Gabon left and the number reduced to 11.
In 1973, member nations decided to restrict their production by negotiating quotas. Then, OPEC accounted for almost 70% of the world’s supply of crude oil and 87% of world oil exports. Thus, although it was not a monopoly, it had substantial market power. As a result of the Output restrictions by OPEC, the crude price role from $ 2.50 per barrel in 1973 to $11.17 per barrel in 1974. This resulted in substantial market gains to the OPEC and the wealth of member countries swelled considerably. OPEC was successful in increase the crude prices to over $ 40 per barrel in 1980, resulting in inflows of wealth and money into the member nations. The reasons for its success were :
- The demand for crude oil in the world was highly inelastic in the short run.
- Member nations provided a large proportion of the total world supply of crude oil.
- The non -OPEC countries were not able to increase their production of crude oil quickly in response to the price increase.
Its a diagrammatic presentation of OPEC’s early success story. The supply curve of oil of non -OPEC countries is given by SN. Initially, OPEC nations are willing to supply all the oil demanded at the world price OP and thus, the world supply curve of oil is SW. It intersects the world demand curve (D) for oil at point E.
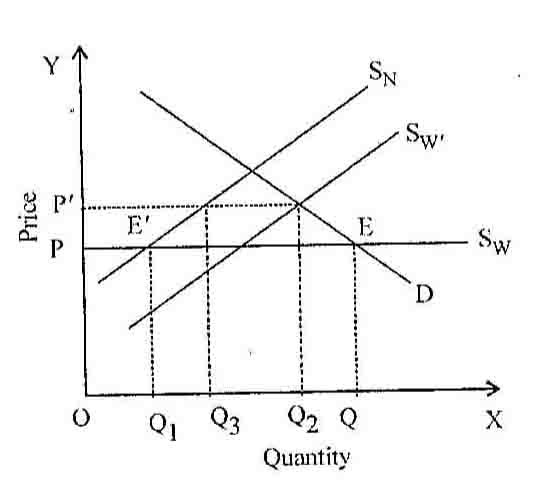
Thus the world production of crude oil was OQ of which OQ, was supplied by non -OPEC countries and. OQ-OQ1=Q1Q by the OPEC nations.
When it fixed quotas for member and restricted output, the world supply became Sw, and supply curve of non -OPEC nations was SN. The vertical distance between SN and Sw gives OPEC production of oil. The new world supply curve (Sw) intersects the world demand curve (D) at point F. Thus, after imposing restriction, the world price rose to OP’ and the world output got reduced to OQ2 . At this price, non -OPEC nations supplied OQ3 quantity of crude oil and that supplied by OPEC was OQ2 — OQ3 = Q3Q2.