Write a note on Derivation of labor supply curve.
Derivation of labor supply curve: Firstly, we look at the total supply of labor. The number of people willing to work is called the labor force and the total number of hours they are willing to work is called the supply of labor. Further this supply of labor depends on three sets of factors.
- The size of population,
- The proportion of the population willing to work, and
- The number of hours worked by each individual.
Each of these is partly influenced by economic forces as well. The wage is a major determinant of not only the number of people in the labor force but also the number of hours worked. In order to work, the workers need to give up their leisure and get their incomes in the form of wages to buy goods. Therefore, they find a trade off between leisure and work.
Generally, a rise in wage rate implies a change in relative prices of goods and leisure. Goods becomes cheaper relative to leisure, since each hour worked buys more goods than before. Also increase in wage rate means that leisure becomes more expensive. Since each hours of leisure consumed is at the cost of more goods foregone. This shows in terms of a graph a backward bending supply curve based on the result that, as real hourly wage rate rises for the economy as a whole, people wish to reduce the number of hours they work.
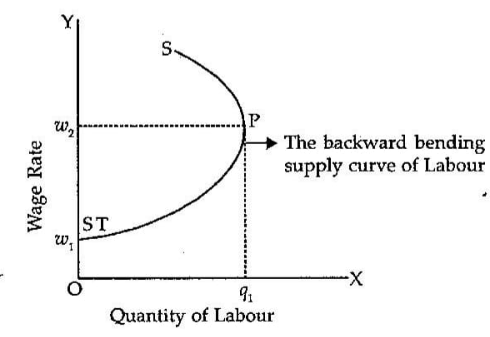
This diagram plots the number, of hours worked against the wage rate. At wage rate of upto w1 the individual is not in the labor force, since no work is offered. As the wage rate rises from w1 to w2, more and more hours are worked, so the supply curve of labor has the normal positive slope.
The wage rates higher than w2 result in the decline in supply of labor. So above w2,the supply curve has a negative slope and this latter case is referred to as a backward bending supply curve of labor.