Explain and draw Price-Consumption Curve and Income and Income-Consumption Curve.How would you derive the demand curve from the price-consumption curve?
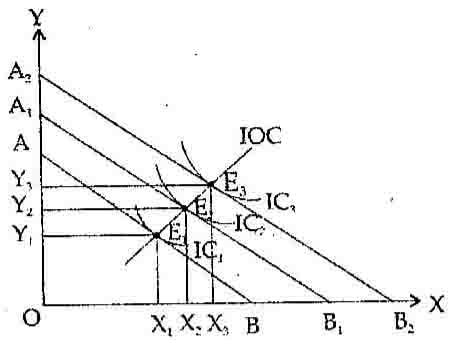
Income consumption curve may be defined as the locus of points representing successive consumer equilibriums as the income of the consumer increases, keeping prices of the two goods constant. This can be explained with the help of the given diagram. Suppose the initial budget line is given by AB and the initial equilibrium is E1 denoting the optimum quantity OX1 and OY1 being purchased by the consumer to maximize their satisfaction.
Let money incomes of the consumer increases. This leads to a parallel outward shift of the budget line to A1 B1. The new equilibrium is attained at E2 point leading to an increase in quantity demanded of both good X and Y assuming that these are normal goods. Now we join points of equilibrium E1 and E2 due to change in income, then we get ICC. Since both x and y are normal, therefore, their quantity demanded increases from (Ox1,Oy1) to (Ox2, Oy2) keeping their prices constant and we get positively sloped ICC. The ordinary demand curve of a good can be derived by using IC technique particularly using the price consumption curve (PCC).
FCC may be defined as the locus of different equilibrium points showing optimal consumption when the slope of the budget line changes due to change in price of a good. This assumes that price of other good and money income of the consumer is constant. Since demand curve is the locus of price and quantity combinations of a good, FCC can be used to derive the demand curve as shown in the following diagram.
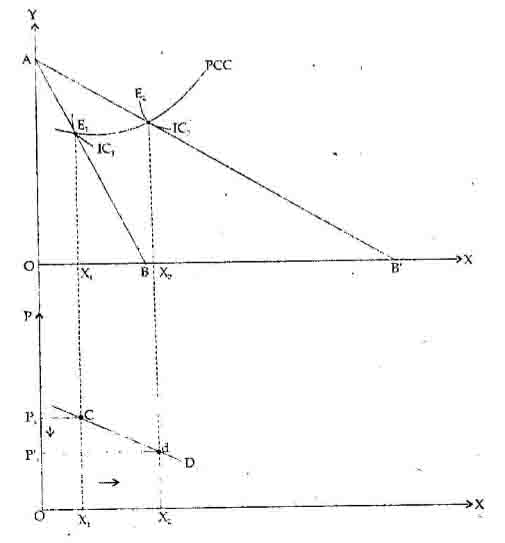
Initially the equilibrium of the consumer is given at point E1 where the given budget line AB is tangent to the indifference curve IC1 Now suppose P falls to Px this implies a rightward swing of the budget line to AB’, and new equilibrium at E2. At this new equilibrium, after the fall in the price of X ceteris paribus, the quantity demanded of X1 increases from X1 to X2. By joinin the two equilibrium points E1, and E2 we get PCC of X.
In the lower diagram, we take price of X on the vertical axis and quantit demanded of X on the horizontal axis. By plotting the price and corresponding quantity demand of good X by the consumer, we get the demand curve of good X. This simply shows that as the Px falls to P’x, quantity demanded of X increased from X1 to X2 we join point c and d to get the downward sloping demand curve of good X.