Explain a firm’s equilibrium with the help of isoquants and isocost line.
If a producer seeks to minimize the cost of producing a given amount of output the condition of the equilibrium, is that the marginal rate of technical substitution must be equal to the factor price ratio.
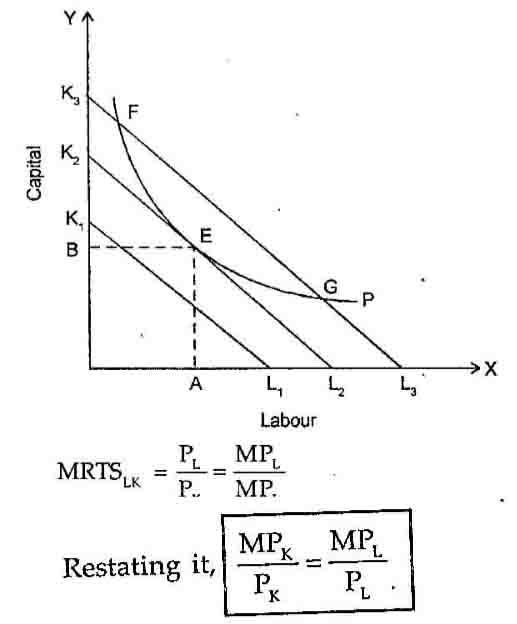
A single isoquant P, in the figure denotes the desired level of output, but there is a set of iso-cost lines representing various levels of total cost outlay. An iso-cost line closer to origin indicates a lower total cost outlay. ISo-cost lines are parallel and thus have the same slope PL/Pk , because they have been drawn on the assumption of constant prices of factors.
Iso-cost line K1 L1 is just not relevant because the output level represented by the isoquant P is not producible by any factor combination available on this iso-cost line. P level output can be produced by the factor combinations represented by the points F & G which are on iso-cost line K3 L3 . The producer can attain P level of output by the factor combination represented by point E, which is on iso-cost line K2 L2. Since K2 L2 is closer to origin as compared to the iso-cost line K3 L3, it represents relatively lower cost. By moving from F to E or from G to E, the producer attains the same output level at a lower cost.
The producer minimises his costs by employing OB amount of capital plus OA amount of labour determined, by the tangency of the iso-quant P with the iso-cost line K2L2. Points representing factor combinations below E are certainly preferable because they represent lower costs but they can’t be considered as they can’t help in providing the output level represented by the iso-quant P.